Posts

M1 - Map Critique

Image
  Map Critique of Well-Designed and  Poorly-Designed Maps This week's module focused on assessing maps and what makes a good, effective map. I enjoyed learning about the different elements of maps and how to look out for them when searching for or creating maps. I find it crucial that maps are designed to fit the intended audience's needs, educational standards, etc. Proper legends, scale bars, symbols, colors/fonts, placement and organization are all crucial in ensuring a map is designed well and easy to read/understand. Below I have included an example of a well-designed and poorly-designed map and a completed critique and synopsis for each. W ell-Designed Map https://i.redd.it/whea49oipy331.jpg General What is the purpose (substantive objective) of the map? The purpose of this map is to showcase the busiest airports in the continent of Europe by the number of passengers on board. What is the “look and feel” (affective objective) of the map? The map is a bit cluttered, ...

GIS 5007: Computer Cartography Introduction & Story Map

Computer Cartography Introduction My name is Marshall and I am pursuing my Masters in GIS Administration here at UWF. I also currently work full-time as a Clinical Pharmacy Technician for a Pharmacy Benefits Management company. However, my background and true passion lies in the Environmental Sciences. After graduating with my undergraduate degree and seeing the sheer amount of job postings that prefer or require candidates to have GIS experience, I figured now would be a perfect time to go back to school and brush up on my GIS skills. Thus, I decided to apply to and enroll in UWF's stellar GIS program. I cannot wait for another interesting course and to learn more about a field that is going to make such a great impact on our world. Upon attaining my graduate degree, I hope to gain employment within an organization that utilizes GIS mapping to highlight, analyze, and solve environmental issues. More about me: I absolutely love spending my time outdoors whenever and where...

M5 - Supervised Classification

Image
  Supervised Classification Map of Germantown, Maryland This lab was one of my favorites thus far, and involved a variety of new concepts/tools that are definitely very useful and powerful. I initially ran into troubles renaming my recoded classes, but I found that one must write the name of the recoded classes with their new class names before recoding. Other than this minor discrepancy, I enjoyed working through this assignment. I found it very important to use a band combination that has a large spectral difference to ensure there is little confusion within the classes. Secondly, I found it very important to use colors for the classes that are noticeably different from one another so that one may distinguish between classes in the image. I enjoyed using the distance image to find areas of the map that needed more signature to be added to ensure overall classification accuracy. One other minor issue I had was not having the 'Unclassified' class exist or appear in the legend, ...

M4 - Spatial Enhancements, Multispectral Data and Band Indices

Image
  Feature Identification Using Spatial Enhancement Techniques I am becoming very confident in my GIS abilities and am much more comfortable with ERDAS Imagine software after this assignment. It was very enjoyable learning how to identify features within ERDAS and I will certainly use the techniques learned in this lab in future assignments. The histogram was crucial to my understanding of pixel values and what they mean. Utilizing grayscale/panchromatic images allowed me to notice trends that I would not otherwise see. I found that altering the band combinations allowed me to distinguish features from their surroundings, and I enjoyed changing these combinations to best suit the purposes of my final map layout. For my final layout, I decided to get creative and utilize a series of lines and polygons to create more unique subset maps that would showcase the features in a larger view. This final map I am very proud of and I enjoyed making it every step of the way. 

M3 - Introduction to ERDAS Imagine and Digital Data

Image
  Classified and Measured Washington Forested Land This week's lab involved utilizing a brand new software, ERDAS Imagine, to alter and express data. I greatly enjoyed being able to work outside of ArcGIS and appreciated learning the features and functionalities of this new software. I did encounter a few errors throughout the assignment, as a multitude of steps were either outdated or have changed since the creation of the lab. For example, the creation of the 'Area' field on ERDAS imagine did not properly adjust the areas of the classified lands as it should have. Also, there was no plausible way to adjust the Legend to display the areas of the land swaths, without manually having to do so via the labeling function. The second part of this lab (Part b) was very useful in learning more about the functionality of ERDAS Imagine, and I enjoyed learning how to find the spatial resolution on the software. It was interesting comparing how many of the functions of this app are si...

M2 - Land Use/Land Cover and Ground Truthing

Image
  LULC Map of Pascagoula, Mississippi This week's laboratory assignment involved the creation of a Land Use/Land Cover map of a certain city in Mississippi. I was able to practice my editing and classification skills to create the map using a series of polygons in a created shape file. Upon creating these polygons, I classified them based on their unique land use/land cover characteristics and then labeled them. Then, I used the random point generator tool to create a series of 30 points that I would use to assess the accuracy of my classifications with Google Maps' Streetview. I really enjoyed this assignment, because I felt that my own unique perspectives and classifications were able to be used and it feels like the maps I am producing are becoming increasingly complex. It was difficult at first to distinguish between the different LULC classes, but miniscule differences (such as building shape/size, presence of parking lots, vegetation coverage, etc.) began to make all the ...

M1 - Visual Interpretation

Image
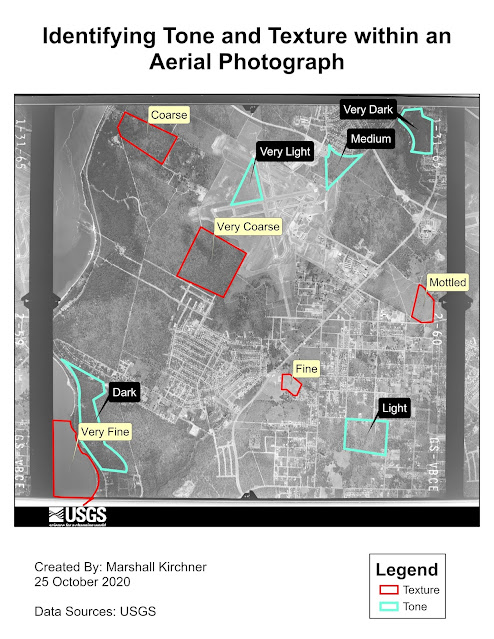
  Aerial Image Tone and Texture Identification For the first part of this laboratory assignment, I identified and labeled areas of an aerial image. This involved the utilization of editing skills previously learned in the GIS program at UWF. I enjoy practicing my polygon creation techniques, and found the process as a whole to go by quicker with time. I created two separate feature classes that would include shapefiles of both textures and tones to hold the created polygons. I then used the calculate tool for the attribute tables of each to create names for the resulting tones and textures. I enjoyed using the labeling tool to label these polygons based on their names, and editing the symbology so that the labels would be easy to read and identify. I struggled at first with having the labels cover the areas in which they were representing, but I found that in the labeling tab, one is able to position them so that they lay on the outside of the created polygons. Ultimately, I really...

M6 - Georeferencing

Image
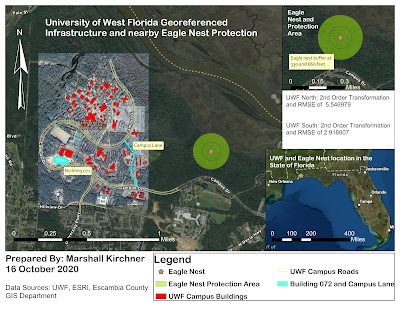
  University of West Florida Georeferenced Infrastructure and nearby Eagle Nest Protection Three Dimensional Map Showcasing the University of West Florida Campus The final laboratory assignment of this course was informative, exciting, and all-encompassing. I was able to apply concepts learned from previous labs while continuing to expand upon my GIS knowledge. This assignment resulted in the creation of two separate maps, one being of the final georeferenced image of UWF's Campus (and an inset map of the eagle nest), and the other being a 3D map of UWF's campus. I was able to use georeferencing to overlay pictures to create the UWF campus map and Heritage Hall's planning image. This was a skill that I greatly enjoy utilizing, as I find it very pleasing watching images align after placing control points. I used the editing tab to add a building (079) and road (Campus Lane) to be used in both the final campus and 3D map. For the 3D map, I was able to learn how Lidar imagery ...

M5 - Add XY and Geocoding

 Link to web map http://arcg.is/1yjyuv0 This two part lab was very informative, interdisciplinary, and engaging. I learned a multitude of new GIS concepts throughout this lab that will certainly be applicable to my future coursework and career. Starting out with creating and manipulating data in the excel spreadsheet allowed me to understand how the data should look for implementation into ArcGIS Pro and was good practice in brushing up on my Excel skills. After doing so and importing the data into the map, I was able to use an address locater and geocode to produce a basic map of all of the schools within Brevard County, Florida. The usage of the different tools and skills that were utilized in this lab were all very exciting and fun to work with. What I had trouble most with was exporting my map to a web map version, which I have learned the basics of through much troubleshooting. Essentially, the basemap and the layers I had created were of two different projections and I simply...

M4 - Vector Analysis

Image
  Vector Analysis Map This lab involved utilizing a variety of tools including utilizing new tools that I have not previously worked with: the buffer tool and the overlay tools. Working with these tools, I was able to produce a map that shows optimal campsites in Mississippi's De Soto National Forest. This was done utilizing a variety of queries (both attribute and location) that allowed me to create buffers around rivers and streets throughout the forest. I really enjoyed working with the queries and new geoprocessing tools, as they allowed me to utilize spatial data analysis to help answer a question. It is becoming more and more clear how GIS can be used in a variety of real-world applications, and applications like this could even be useful for one's own personal use if they ever wanted to go camping in a place like De Soto National Forest. Through creating the map, I also used a data layer that consisted of conservation areas around the forest (that contained plants and an...

M3 - ArcGIS Data Collector and Introduction to Projections

Image
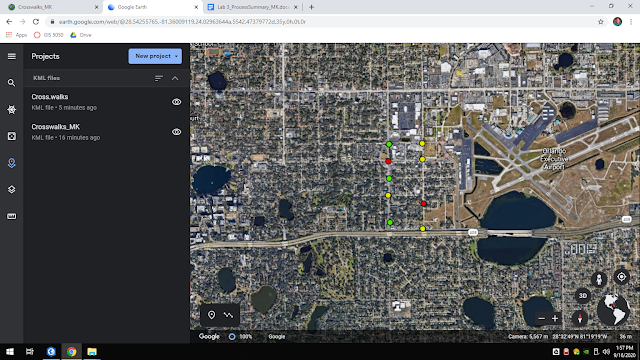
ArcGIS Data Collector Map The first portion of this lab assignment involved using the ArcGIS Data Collector application on my phone to collect data points around my area. This data was to be based on public safety features of our choice, so I chose crosswalks. Upon walking around, taking pictures of my data, writing descriptions, etc., I was able to come up with nine data points on my app. I linked my data back to my map via the ArcGIS Online software, and the data appeared on the map. I then used this data to make various KMZ files and was even able to upload these files to Google Earth to also showcase my data on a different platform. My favorite parts of this lab were being able to collect my own data out in the field and becoming better acquainted with other GIS software platforms (other than ArcGIS Pro). I initially struggled with uploading my KMZ files to Google Earth, but was able to find success after reviewing the discussion board for this module and finding another student ha...

M2 - Cartography

Image
  Cartography Map For this week's laboratory assignment, I created two maps. The first of which showcases the University of West Florida's location within Escambia County. The second is an inset map with Escambia County's location in Florida. I was able to use many more features of ArcGIS pro, including:  Clipping Bookmarking Inserting text and pictures Legend Scale Compass Symbology Throughout the assignment, I made many choices and ultimately tailored the map to look the way I thought would best represent the data. I am very proud of my final map design! Although it looks fairly simple, it took a great amount of time troubleshooting and playing with the features to get the map to exactly the point in which I want ed it. Being able to make many cartographic choices that altered the overall appearance of the final map was my favorite component of this lab assignment. My biggest struggle was keeping my files organized while working through the lab. I find that it is best to...

M1 - Overview of ArcGIS

Image
  First Map Created Using ArcGIS Pro I greatly enjoyed becoming better acquainted with ArcGIS Pro and being able to create my first map all on my own. It was quite exciting seeing how a few clicks could change the appearance of the map in its entirety. To produce the map above, I imported data including cities and countries and used symbology to enhance some of the features on the map. I chose a red gradient for the countries, as I felt it showed the contrast of them from one another and the ocean. I also lowered the size of the dots used to represent cities, as the initial size was too large and the cities would blur together and take up nearly the whole map.  Some of the highlights I experienced while working on my first lab would include: learning how to navigate and utilize the files used to create the maps, playing with the various ArcGIS Pro features and figuring out my own mapping style, and taking much less time creating the map than I initially anticipated it would re...