Posts

Showing posts with the label GIS 5100- Applications in GIS

Module 6 - Hazards: Damage Assessment

Image
Link to Storymap:  https://arcg.is/1bfbDH This final module of the course was an excellent, all-encompassing project in which we were able to expand upon the analyses made in the previous module and map the damage from the storm itself. Many steps were conducted to come to helpful, useful conclusions that could be used for disaster response teams in the wake of natural disasters such as Hurricane Sandy. I personally believe that mapping structural damage could be extremely useful in future instances of hurricanes, as this application allows one to collect data and draw conclusions without having to be in the field. While there were certainly limitations (that will be discussed later in this post), overall, I enjoyed this analysis greatly and would enjoy doing similar work in my future career path. First, I wanted to assess the data provided in the lab and how it may be used to map the storm. The data in the SandyTrack table was recorded between 3:00 PM on 10/22/2012 to 3:00 AM on 1...

Module 5 - Coastal Flooding

Image
This week's laboratory assignment highlighted how to conduct coastal flooding analyses and map buildings affected by such disasters. The coastal flood analysis was conducted on two separate areas, one in Eastern New Jersey and one in Southwestern Florida. These areas are both prone to tropical storms and hurricanes and have experienced catastrophic hurricanes in the past. Thus, it is crucial to understand historical trends to better protect individuals and infrastructure from future weather related events. Whilst there are a multitude of layers, calculations, and steps that go into such coastal flooding analyses, they are critical in understanding natural disasters and their effects on communities. I will now go into more detail on how I conducted my analyses, what steps I took to attain my data, and what the maps and data mean for these communities and disaster management. Imagery Layer Created Change Layer I began my New Jersey analysis by creating a change layer from the pre and...

Module 4 - Crime Analysis

Image
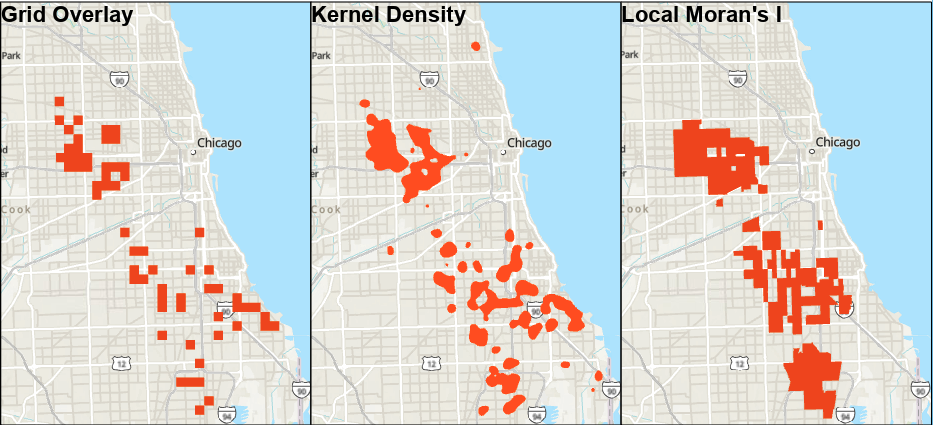
Comparison of Crime Analysis Methods This week's laboratory assignment involved mapping and analyzing crime data for the Washington DC and Chicago metropolitan areas. Utilizing the various methods available to showcase this data was  enlightening and demonstrated the importance of selecting the most suitable method for a particular analysis. Noting the differences between the methods and what this could mean for cities is vital in their understanding. A simple dot map of crime locations is not very meaningful on its own, but aggregating the data and enhancing it through the abundance of tools in ArcGIS Pro allows for more meaningful analyses to be made. Looking at the maps produced through the various methods in the lab, one may notice particular trends within the Chicago metropolitan area and which areas are more prone to crime. The Chicago crime hotspot map that appears best for predicting future homicides would likely be the Grid Overlay. This is because the crime density was hi...

Module 3 - Visibility Analysis

Image
This week, I completed four exercises under the ESRI course 'Get Started with Visibility Analysis.' These four exercises were: Introduction to 3D Visualization, Performing Line of Sight Analysis, Performing Viewshed Analysis in ArcGIS Pro, and Sharing 3D Content Using Scene Layer Packages. These exercises were completed in lieu of a form lab assignment, but nonetheless offered critical skills and practice in an important topic in GIS capabilities. I took a great deal away from this week's assignment and inherently will utilize what I learned in future assignments and projects. I am excited to share what I have learned throughout this course and my overall takeaways of the assignment. Working through these courses, completing the exercises, and taking the quizzes helped in solidifying my understanding of visibility analysis and 3D imagery. The strong focus on ArcGIS Pro and its capabilities was elemental in mastering this fairly new craft. I believe it is truly incredible ho...

Module 2 - Forestry and LiDAR

Image
  LiDAR Analysis of Shenandoah National Park Forest This second laboratory assignment of the course involved the use of LiDAR data from the United States Geological Survey and altering it to create meaningful data for foresters. The data produced in this lab is useful because it can aid in determining overall forest health. Knowledge is critical in managing forests, and knowing where trees lie within the park, areas where there is old vs. new growth, and tree density patterns is of the utmost important in determining best management methods. Forest management methods are complex and require forest data to determine best practices. It is unique in this instance, as one does not have to go out in the field or even be near the forest to learn quite a bit  about it. Ultimately, foresters can use this data  to determine where they should plant more trees, where controlled burns should take place, and areas that should be protected.  Initially, I had to process the .las fi...

Module 1 Scenario 4 - Suitability Analysis / Least Cost Path Analysis

Image
  Corridor Analysis Map for Black Bear Movement in Coronado National Forest Scenario 4 of this module required making a least cost path / corridor analysis that would highlight areas in which Black Bears would likely travel between Coronado National Forest in Arizona. This analysis was very self-directed and I was able to utilize all of the skills and concepts acquired throughout the module. The corridor analysis is very useful in real-world settings, and can be used in a variety of fields and applications. This particular example of Black Bear corridors would be useful in Wildlife Monitoring and Infrastructure / Environmental Planning. It is important to consider a multitude of factors when running a analysis such as this one. The factors I took into account were the elevation, land cover type, and distance from roadways. Other potential spatial elements that could be considered fo future analyses would be food availability, distance to water sources, and distance to civiliza...

Module 1 Scenario 2 - Suitability Analysis / Least Cost Path Analysis

Image
  Map Layout Comparing Two Weighted Overlay Methods The second scenario of this module's laboratory assignment was based around us helping a property developer determine if a parcel of land is worth buying. Essentially, I was to use a multitude of land factors to determine which parts of the land would and would not be suitable for development. For example, those with lower slopes, closer to roadways, and with adequate soil are more suitable for development. I used a variety of ArcGIS Pro tools in this analysis, including the Polygon to Raster, Euclidean Distance, Slope, Reclassify, and Weighted Overlay tools. Steps Taken in Completing the Suitability Analysis First, I decided to reclassify the raw data to assign different factors of the data suitability levels. This was essential in having each raster containing the same value scale. I ran the Euclidean Distance tool on both the rivers and roads shapefiles to have a distance output that would be used in this reclassifying process....

Introduction Post

My name is Marshall and I am pursuing my Masters in GIS Administration here at UWF. I also currently work full-time as a Clinical Pharmacy Technician for a Pharmacy Benefits Management company.  However, my background and true passion lies in the Environmental Sciences. I am very passionate about our natural world and believe GIS is an amazing tool in understanding and protecting it. Thus, I decided to apply to and enroll in UWF's stellar GIS program, because of its comprehensive curriculum and flexible learning environment. I am excited to be enrolled in another fascinating course and to learn more about a field that is going to make such a great impact on our world. Upon attaining my graduate degree, I hope to gain employment within an organization that utilizes GIS mapping to highlight, analyze, and solve environmental issues. More about me: I absolutely love spending my time outdoors whenever and wherever. Hiking kayaking, you name it. I also grew up in a suburb of Chicago and ...