M3 - ArcGIS Data Collector and Introduction to Projections
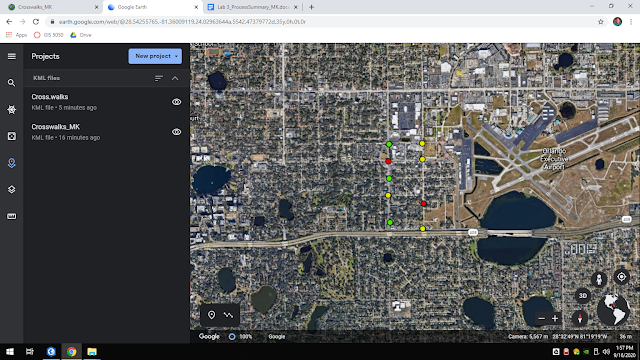 |
ArcGIS Data Collector Map |
The first portion of this lab assignment involved using the ArcGIS Data Collector application on my phone to collect data points around my area. This data was to be based on public safety features of our choice, so I chose crosswalks. Upon walking around, taking pictures of my data, writing descriptions, etc., I was able to come up with nine data points on my app. I linked my data back to my map via the ArcGIS Online software, and the data appeared on the map. I then used this data to make various KMZ files and was even able to upload these files to Google Earth to also showcase my data on a different platform. My favorite parts of this lab were being able to collect my own data out in the field and becoming better acquainted with other GIS software platforms (other than ArcGIS Pro). I initially struggled with uploading my KMZ files to Google Earth, but was able to find success after reviewing the discussion board for this module and finding another student had come across the same issue. I find that many other students come across the same issues in their projects and it is very wise to collaborate among ourselves to find similar issues and resolutions!
 |
| Introduction to Projections Map |
The second portion of the Module 3 laboratory assignment involved exploring projections on ArcGIS Pro. For this lab, I studied three different projections, the Albers Conical projection, UTM 16, and the State Plane North protection. I used the state of Florida and three select counties to demonstrate how these minor differences in the projections can result in noticeable differences. I found that the projections resulted in different areas of various Florida counties and used a table to showcase these differences. For my layout, I produced a set of three maps that show the state of Florida and the selected counties all under the different projections. I greatly enjoyed learning about how projections can drastically distort data and how it is important to use the same projection when working with different sets of data. I initially struggled with not having much guidance on how to create my final layout. Eventually, I was able to use the ArcGIS Help page and various troubleshooting methods to figure out all of my issues and produce a layout that I am proud of!