This week's laboratory assignment highlighted how to conduct coastal flooding analyses and map buildings affected by such disasters. The coastal flood analysis was conducted on two separate areas, one in Eastern New Jersey and one in Southwestern Florida. These areas are both prone to tropical storms and hurricanes and have experienced catastrophic hurricanes in the past. Thus, it is crucial to understand historical trends to better protect individuals and infrastructure from future weather related events. Whilst there are a multitude of layers, calculations, and steps that go into such coastal flooding analyses, they are critical in understanding natural disasters and their effects on communities. I will now go into more detail on how I conducted my analyses, what steps I took to attain my data, and what the maps and data mean for these communities and disaster management.
 |
| Imagery Layer |
 |
| Created Change Layer |
I began my New Jersey analysis by creating a change layer from the pre and post storm layers. I altered the symbology to highlight the areas most impacted by the disaster. When studying my change file, I zoomed into an area that would highlight these changes and could be compared to the regular satellite imagery basemap. I chose this specific area above, because it is a clear example of the destruction that resulted from the hurricane and how it affects the change file. The change file marks this area as dark red, meaning it encountered significant destruction and/or erosion from the hurricane. The buildings file does not account for the six homes that are present in the imagery layer. Thus, this likely means the homes were completely destroyed and no longer salvageable due to the hurricane. Through conducting a series of calculations and spatial joins, I was able to determine that around 72.33% of Cape May County may have been affected by the 2-meter storm surge. This is an astounding figure and shows the sheer impact this disaster had on New Jersey and its coastal communities.
 |
| Mapping Change Layer Showing Destruction and Erosion from Hurricane Sandy |
The pre and post files mostly consist of lower values that are closer to the shorelines of the coast and inlet. The post file contains more instances along the coasts of low values, as well as mid-range values where buildings and infrastructure exist. Otherwise, there is a very high value located towards the center of the data in the pre file that is not present in the post file. The darker red portions of the map faced more damage, as their areas faced erosion or destruction, while the blue areas had buildup. The color ramp indicates that the areas directly on the shoreline and those near bridges faced significant damage from Hurricane Sandy. One may notice that most areas located in the inlet are relatively scattered in terms of facing damage from the hurricane or not. This means that those closest to the shore (whether developed or not), faced more damage than those further inland.
It is important to remember that things often change, and are not always due to what a particular study or analysis is highlighting. For example, if a tree is cut down post-disaster, this does not necessarily mean it was due to the disaster itself. Also, it is important to understand that the change outputs/files are not always going to be 100% accurate. They may indicate differences in the pre and post files that are not relevant to the study, or may have differences due to data acquisition and so forth. A great example of this would be the projection of the pre and post data. If both are not the same, then calculations to create the change file may provide inaccurate outputs.
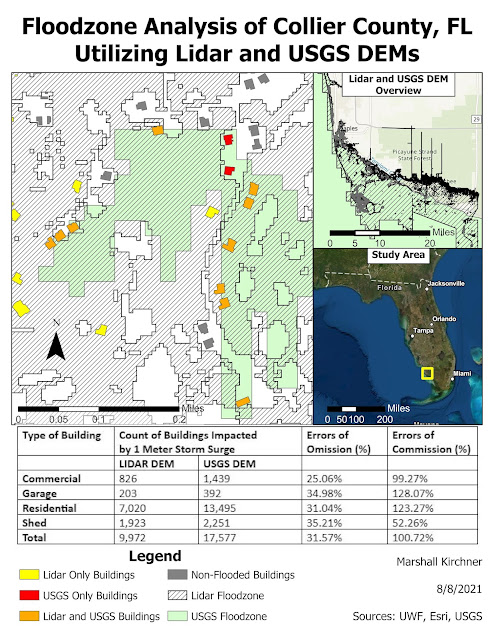 |
| Comparing Buildings Impacted by Floodzones of Varying DEMs |
For the second portion of this lab, I was tasked with isolating buildings in two different DEMS (Lidar and USGS), comparing the counts of the buildings in each DEM/both/neither, and mapping them. These DEMs were tabulated to predict the a floodzone in Southwestern Florida's Collier County. I became well acquainted with the Spatial Join tool, Intersect and Erase tools, and the Select by Attribute/Location tools during this analysis. The combination of these tools allowed me to isolate the different types of buildings and symbolize them as necessary. I found it elemental to symbolize one of the DEMS with a crosshatched interior, so one may see where the DEMs overlap and the buildings that are intersecting with these overlaps. I chose to include two inset maps displaying the overall DEM spread as well as the study area's location on a map of Florida, so one may better visualize the bigger picture and where the analysis took place. For the errors of omission and commission calculations, I used the attribute tables as well as the previously calculated counts to determine these percentages using the pre-defined formulas. All in, I really enjoyed this analysis and find its application extremely useful in disaster management and analytics.
Most of the assumptions made in this approach are not entirely realistic and likely produce inaccurate data. For example, a uniform height storm surge is very uncommon, as areas with valleys or crests will produce varying elevations and would impact the surge level in these localized areas. Also, low-lying disconnected areas may still become flooded due to precipitation, clogged storm drains, etc. and thus it is not justified to exclude ALL of these areas. To make the analysis more realistic, a multitude of additional steps could be taken to produce the most accurate data. One step would be looking at more historical storm surges in the area and determining where the surge fluctuates. This could be used to better tabulate where the surge should be higher or lower in analysis. One could also use this data to better understand the disconnected, low-lying areas and if they become flooded in previous disasters. Another step to make the analysis more realistic would be accounting for more factors that contribute to flooding than elevation, such as precipitation patterns, ground cover type, and taking into account existing storm drains/sewers. Storm surge is not the only cause of flooding in a tropical event. Other likely factors in determining areas at risk for flooding include elevation, land cover type, weather patterns, precipitation, and preventative infrastructure (like sea walls). All of these factors may increase or decrease the surge in certain areas and should be accounted for when conducting a more realistic analysis.

